Project Overview
This analysis explores the 2021-2025 Accenture Talent Outcome & Comp Survey dataset to identify what factors most strongly influence promotions. By applying machine learning techniques, we can move beyond anecdotal evidence to quantify the impact of role, location, and entity.
The dataset, filtered for USA records, includes standardized fields for City and Practice, along with granular details like sub_practice (e.g., Management Consulting) and entity (LLP vs AFS).
Analysis Approach
We utilized a Logistic Regression model to predict the binary target is_promoted.
Key Features Engineered:
- Practice & Sub-Practice: Differentiating broadly (e.g., Strategy & Consulting) from specifics (e.g., Management Consulting).
- Entity: Comparing promotion rates between LLP and AFS.
- Months at Level (MAL): How long an employee has been in their current role.
- Demographics & alignment: Including gender, ethnicity, and business alignment.
Key Findings
The model achieved an impressive 93% accuracy (F1-Score: 0.96 for promoted class), highlighting strong signal in the selected features.
Top Promotion Drivers (Positive)
The chart below displays the coefficients for the top positive predictors of promotion.
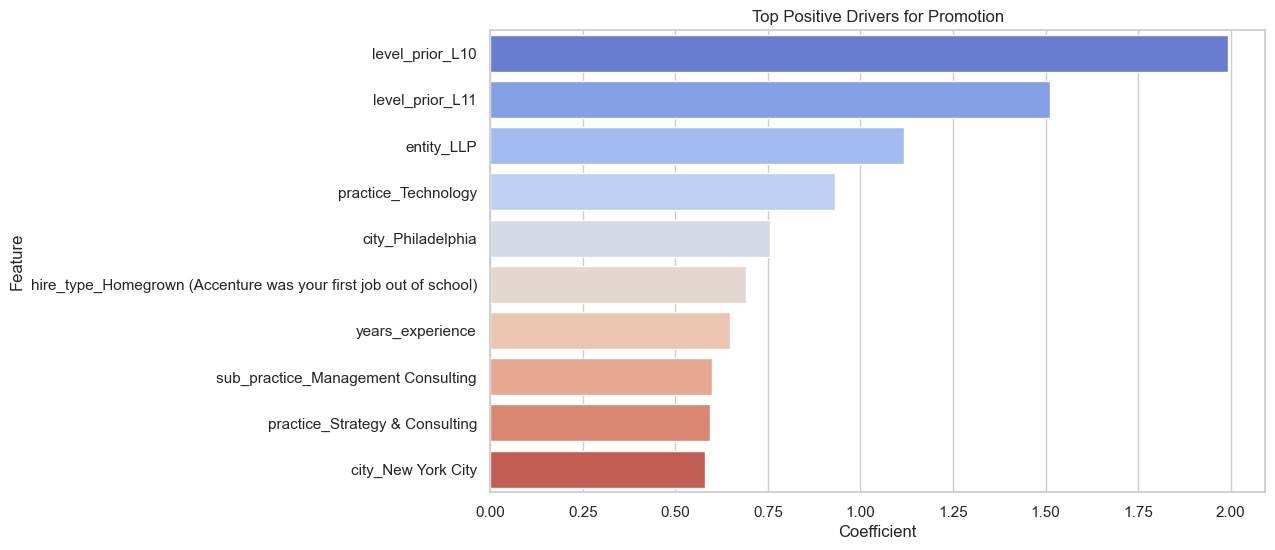
Insights:
- Level Matters: Being at
L10(Senior Analyst) orL11(Analyst) serves as a strong springboard for promotion. - The ‘LLP’ Advantage: The
entity_LLPfeature emerged as a top driver, suggesting structural differences in promotion velocity compared to other entities. - Specialization Pays Off: While the broad Strategy & Consulting practice is positive, the specific
sub_practice_Management Consultingprovides an additional boost. - Homegrown Talent: Employees who started their career at Accenture (
hire_type_Homegrown) show higher promotion odds than experienced hires.
Top Negative Drivers (Promotion Barriers)
While some factors boost promotion odds, others appear to correlate with slower advancement.
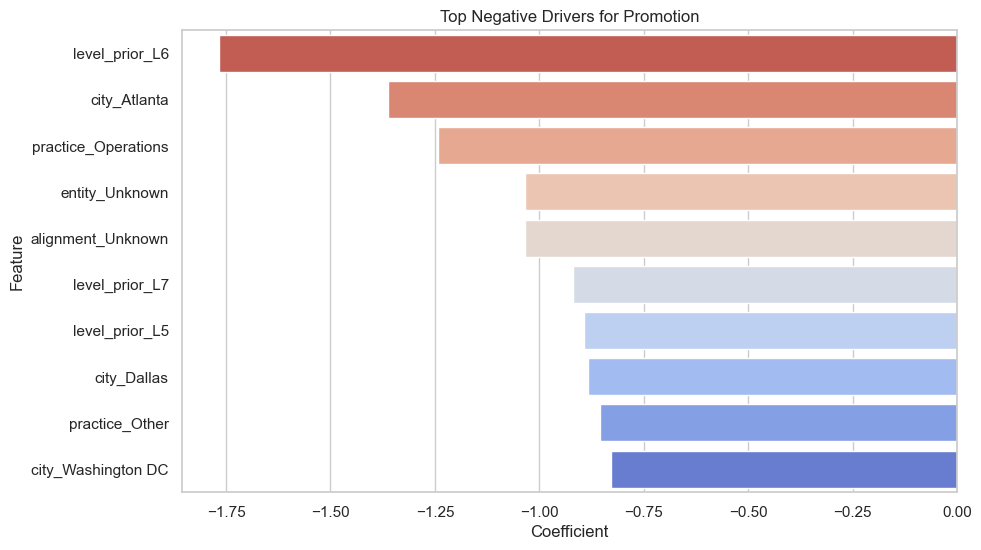
Insights:
- Experience Gap: Higher years of experience (without a corresponding move to senior levels) can sometimes negatively correlate with immediate promotion probability in certain roles.
- Role Stagnation: Specific practice alignments or lower sentiment levels (e.g., “Not sure” about staying) strongly correlate with a lower likelihood of promotion.
- Geographic Factors: Certain cities exhibit lower promotion rates, potentially due to role availability or competitive saturation in those hubs.
City Tiering (Pay Ratio)
Beyond promotion, we categorized cities into tiers based on a “Pay Ratio” (Actual Pay / National Average for Level).
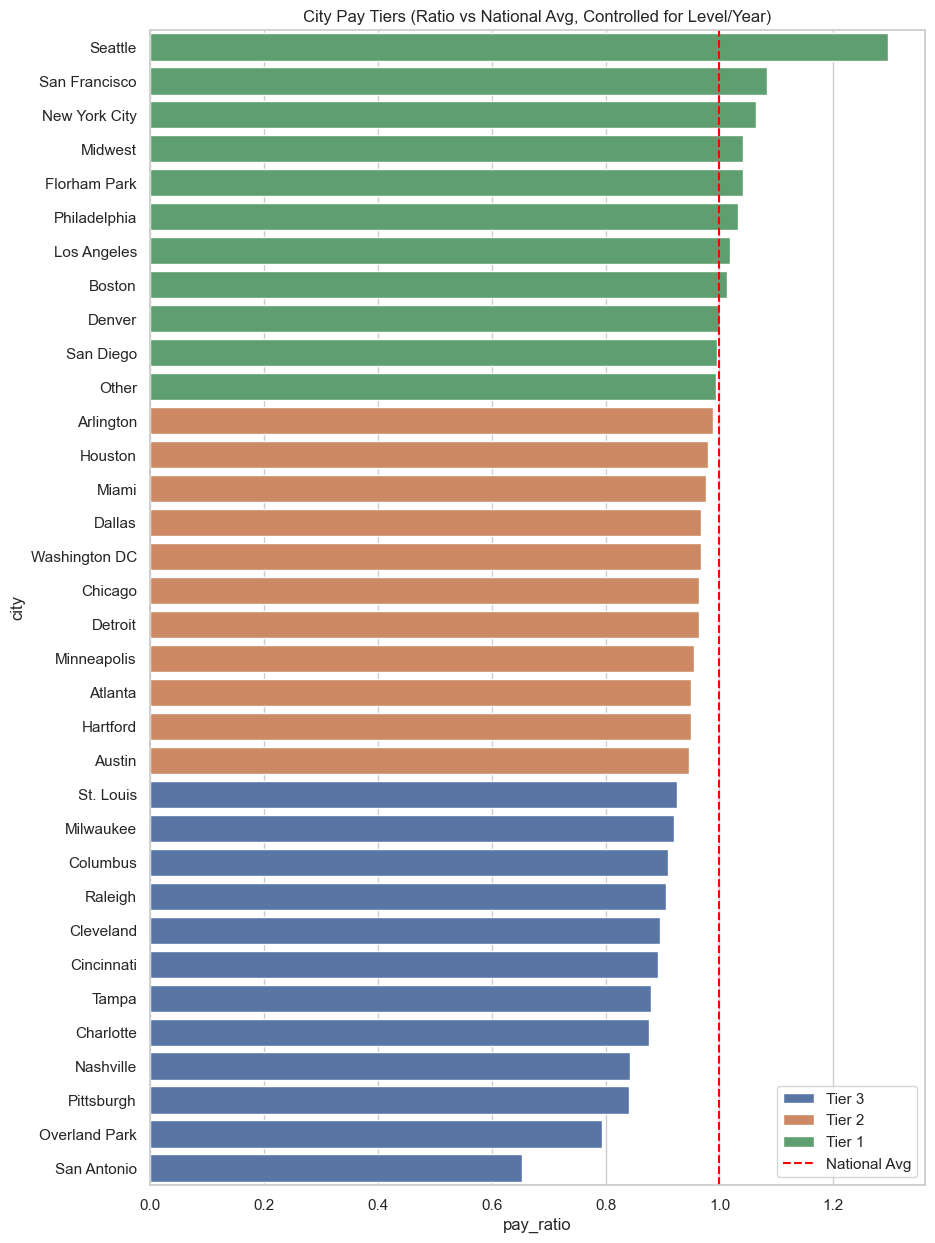
- Tier 1 (High Cost/High Pay): Cities like Seattle (1.30x) and San Francisco (1.08x) showing significant premiums above the national average.
- Tier 3 (Living Cost Adjusted): Areas like St. Louis (0.93x) and Milwaukee (0.92x) where nominal pay is lower, likely aligning with local cost of living.
This segmentation is crucial for evaluating fair compensation across geographies.
Practice Pay Differences
Do certain practices pay more for the same level? The analysis reveals interesting variances.
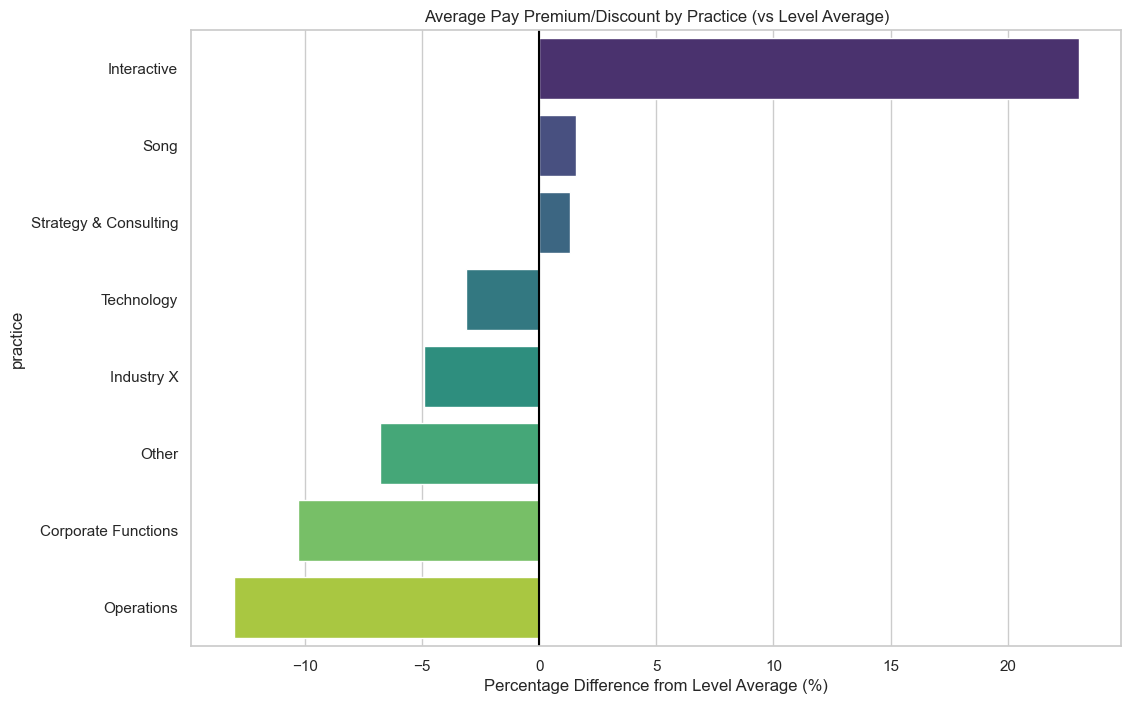
Key Observations:
- Strategy & Consulting tends to command the highest premiums above the baseline for most levels.
- Technology roles show varying competitiveness, often aligning closely with the baseline but with spikes in high-demand niche areas.
Salary Trends (Year-Over-Year)
A look at how salary bands have shifted from 2021 to the present.
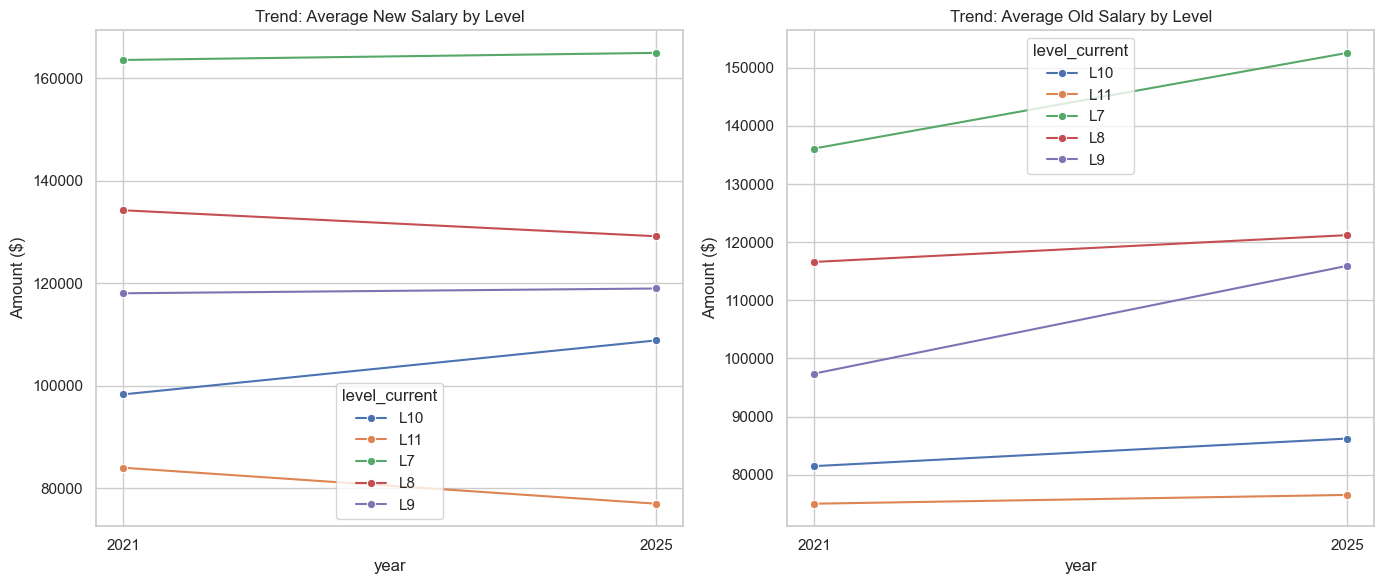
Trend Analysis:
- The data indicates a level-specific shift in compensation bands.
- While inflation has driven up nominal wages, the real purchasing power adjustments vary significantly by level, with junior levels seeing different growth rates compared to senior management.
TODO
- Initial Data Cleaning (City/Practice Standardization)
- Feature Engineering (Sub-practice extraction)
- Logistic Regression Model
- City Tiering & Pay Analysis
- Salary Trend Analysis
- Expand to global dataset (currently USA only)
Last Updated: 2026-01-31