The AI Economic Shift Index (AESI)
The transition to an AI-driven economy is not a single event, but a structural shift affecting multiple facets of the market simultaneously. To track this, I built the AI Economic Shift Index (AESI).
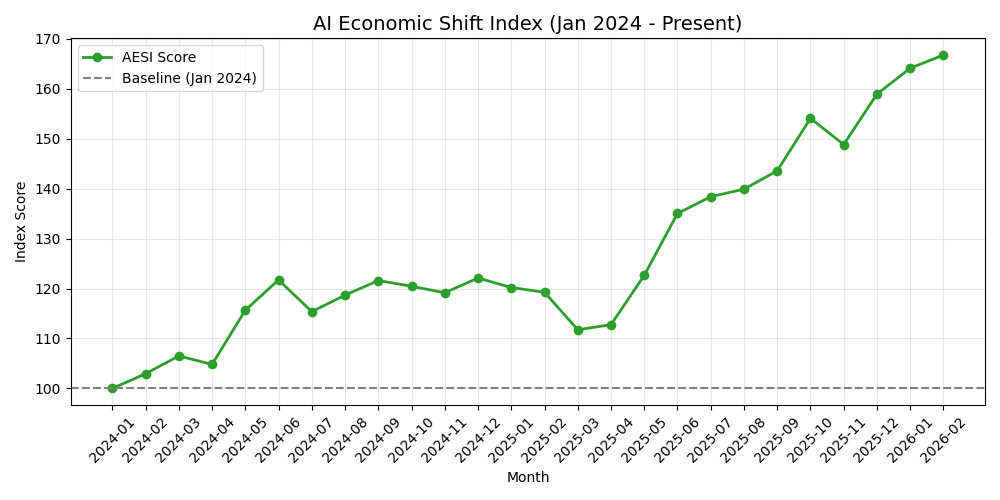
The AESI aggregates daily financial data, monthly macro labor statistics, and real estate pricing into a single monthly composite score. It is normalized to a baseline of 100 as of January 2024. A rising score indicates accelerating structural economic shifting due to AI.
Key Components
The index is composed of three equally weighted sub-indices:
1. AI Market Momentum (Weight: 33%)
- What it measures: The outperformance of AI Semiconductor infrastructure (
SMH,NVDA) relative to the broader S&P 500 (SPY). - Why it’s included: Capital markets are forward-looking. They price in systemic changes long before they appear in GDP data. The massive capital expenditure required to build AI infrastructure flows directly into the revenues of semiconductor companies. Outperformance here signals the “plumbing” of the new economy is actively being constructed.
- What is driving it: Relentless demand for compute by hyperscalers (Microsoft, Meta, Amazon, Google) rushing to build AGI data centers.
2. White-Collar Labor Deflation (Weight: 33%)
- What it measures: An inverse metric combining Tech Layoffs (from
Layoffs.fyiand stateWARNnotices) and JOLTS “Information” Sector Job Openings (JTU5100JOL). - Why it’s included: AI’s promise is extreme productivity. As companies deploy coding agents and automated workflows, they require fewer entry-level or mid-level software engineers. An increase in this sub-index indicates that tech companies are accomplishing more with less headcount.
- What is driving it: The deployment of powerful LLMs and AI Agents allowing companies to flatten their white-collar org charts while maintaining or growing revenue (increased Revenue Per Employee).
3. Macro Ripple & Real Estate (Weight: 33%)
- What it measures: The spread between the National Baseline Zillow Home Value Index (ZHVI) and the ZHVI of legacy tech hubs (San Francisco, Seattle, Austin).
- Why it’s included: Over the last decade, high-paying tech jobs artificially inflated housing prices in hyper-concentrated areas like San Francisco. As AI displaces some of these roles and enables remote, asynchronous work, the housing premium in these cities begins to deflate relative to the national average.
- What is driving it: Tech decentralization. Companies are realizing they no longer need to pay exorbitant salaries tied to high-cost-of-living areas when AI handles routine cognitive work and specialized talent can be hired anywhere.
Results & Visualizations
The AESI has seen relentless growth since early 2024, closing February 2026 at 166.75.
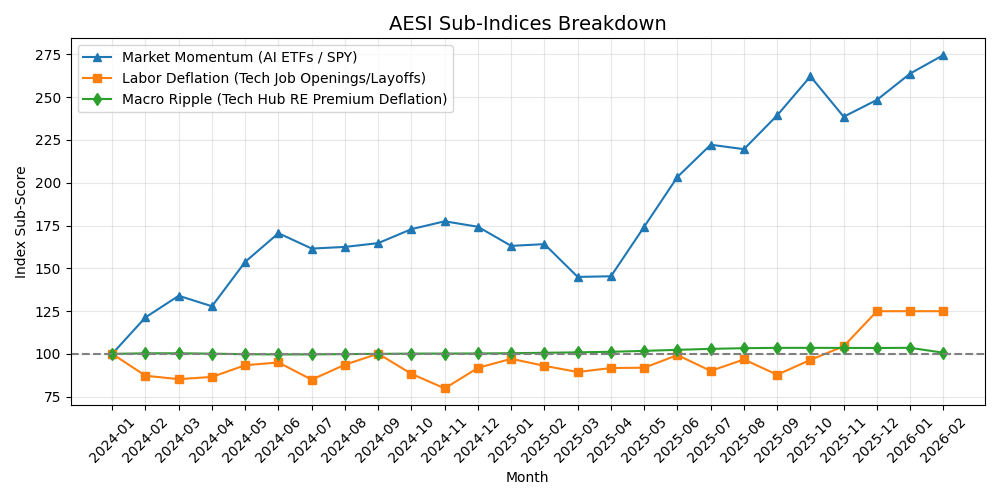
When we break down the sub-components, it becomes clear that Market Momentum (the financial investment in AI chips) has the highest beta, while Labor Deflation has steadily caught up in late 2025 as enterprise AI adoption translated into actual workforce reductions.
Recent Monthly Data Table
| Month | AESI Score | Market Momentum | Labor Deflation | Macro Ripple (RE) |
|---|---|---|---|---|
| 2026-02 | 166.75 | 274.68 | 124.93 | 100.65 |
| 2026-01 | 164.10 | 263.85 | 124.93 | 103.52 |
| 2025-12 | 158.93 | 248.44 | 124.93 | 103.42 |
| 2025-11 | 148.83 | 238.60 | 104.43 | 103.46 |
| 2025-10 | 154.07 | 262.21 | 96.48 | 103.51 |
| 2025-09 | 143.57 | 239.42 | 87.79 | 103.50 |
(Data sourced via FRED, Zillow ZHVI cross-sections, Layoffs.fyi, and WARN notices via native python scrapers.)
TODO
- Add more macro data points
- Incorporate private credit and debt performance
- Spell check
Last Updated: 2026-02-25