Kalshi Price Impact Analysis
This analysis explores the predictive power of Median Daily Prices on the final “Yes/No” outcome of KXFEDMENTION markets. By examining historical data, we identify key price thresholds and “traps” that traders should be aware of.
Dataset & Methodology
- Ticker:
KXFEDMENTION(Target Rate Probability on Fed Mentioning specific words). - Data Range: Daily price history for all events from Jan 2025 to Jan 2026. Which is the first year of the Kalshi Fed Mentioning market.
- Metric: Median Price. We use the median of the daily “mean price” (or “close” if mean is unavailable) for each market to represent its sustained trading level.
- Target: Final Result (Yes = 1, No = 0).
Key Analysis Findings
We employed three statistical approaches to understand the relationship:
- Linear Regression: A baseline model assuming a straight-line relationship which yielded a strong correlation ($r \approx 0.76$).
- Logistic Regression: A probabilistic “S-curve” model, which is statistically more appropriate for binary outcomes.
- Binned Empirical Win Rates: Grouping markets into 10-cent price buckets to observe the actual historical win rate.
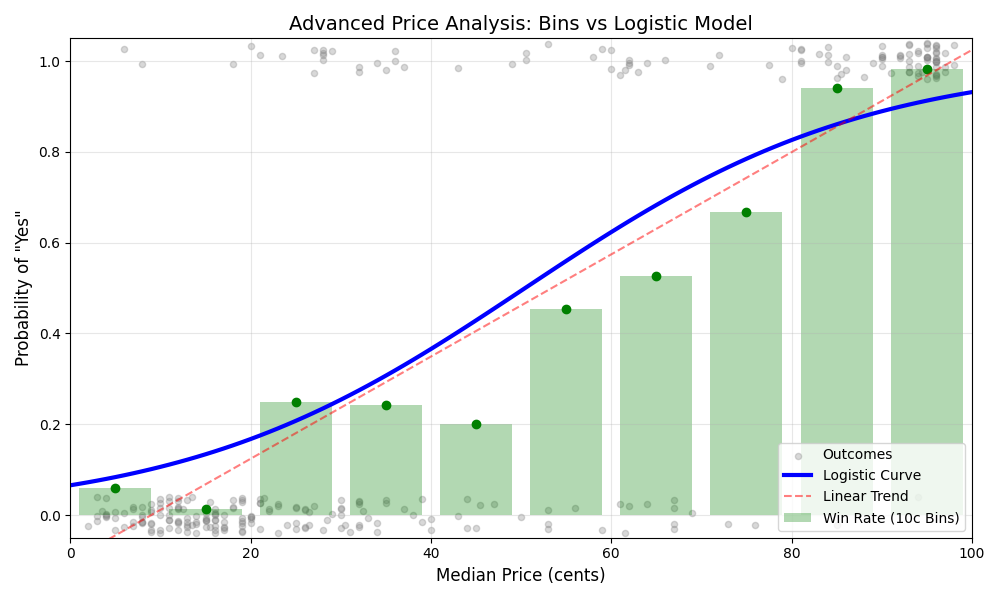
The “10-20 Cent Trap”
The most striking finding from the Binned Analysis is the non-linearity in the lower price ranges.
| Price Range | Win Rate | Insight |
|---|---|---|
| 0-10 cents | 5.9% | Low probability, as expected. |
| 10-20 cents | 1.4% | CAUTION: Markets trading in this range actually performed worse than cheaper ones. This suggests a “trap” where prices are elevated slightly by speculation but rarely deliver. |
| 20-40 cents | ~25% | A modest improvement, but still largely a losing bet. |
The 50-Cent Inflection Point
Both the Logistic Model and the Binned Data confirm that 50 cents is the critical tipping point.
- Logistic Threshold: The model predicts a >50% probability of “Yes” once the median price exceeds 50.46 cents.
- Empirical Jump: The actual win rate jumps from 20% in the 40-50c range to 45-53% in the 50-70c range.
High Confidence Zone
Once a market sustains a median price above 80 cents, the outcome is nearly guaranteed.
- 80-90 cents: 94.1% Win Rate.
- 90-100 cents: 98.1% Win Rate.
TODO
- Initial data collection and cleaning
- Linear & Logistic Regression modeling
- Binned Empirical Probability calculation
- Monitor future events to validate the “10-20 cent trap”
Last Updated: 2026-01-28