🏥 Part 2: MLB Post-IL Performance Decay & Recovery
While knowing how long a player will be on the Injured List is critical for roster planning (as analyzed in Part 1: Injury Duration Analysis), the second half of the equation is even more vital for fantasy success: How will they perform once they return?
Do players bounce back to their baseline immediately, or do they experience a prolonged performance decay upon activation?
By standardizing player value across all 5 batter/pitcher scoring categories using Z-score deltas over a 28-game active window before and after IL placement (matching 794 completed stints between 2023 and 2026), we quantify the post-IL activation slump.
1. Executive Summary & Key Insights
- Concussion slumps are severe: Hitters returning from a 7-day IL stay (almost exclusively concussions) suffer a massive slump, losing a median of -1.76 standard deviations in value. Their average OPS drops by -0.088.
- Rushed pitchers regression: Pitchers activated from short 10-day IL stays show the worst regression (64.5% get worse). SP ERA rises by +0.62 and RP ERA spikes by +1.11, indicating that rushing a pitcher back on a minimum stay before they are fully built up leads to immediate regression.
- The 15-day Pitcher tax: Standard 15-day pitcher stays result in a steady, moderate decay (median $\Delta Z = -0.66$). Expect starting pitchers to give up an average of +0.46 ERA and -2.5 Quality Starts over their first 28 active games back.
- 60-day IL healing benefits: Long-term 60-day IL stays are the only tier where players return with positive value (median $\Delta Z = +2.06$ for batters). Taking the time to fully recover beats trying to play through lingering issues.
2. Methodology & Z-Score Delta Math
To evaluate overall performance change objectively across different categories (R, HR, RBI, SB, OPS for batters; K/9, QS, SVHD, ERA, WHIP for pitchers), we calculate a Z-Score Delta ($\Delta Z$):
\[\Delta Z = Z_{\text{post}} - Z_{\text{pre}}\]- Active Windows: We compare the 28 active games played immediately before IL placement against the 28 active games played immediately after IL activation.
- Filter: To eliminate sample-size noise from short call-ups or immediate re-injuries, players must have played a minimum of 10 active games in both windows to be matched.
- Scaling: Daily counting stats (R, HR, RBI, SB, QS, SVHD) are scaled to a standard 28-game representation.
- Directionality: Signs are inverted for ERA and WHIP so that lower (better) pitching ratios yield a positive (improving) Z-score change.
3. Post-IL Performance Change Distributions
Below is the generated 3x2 grid of histograms showing the distribution of player Z-score changes. Green represents performance improvement, while red represents regression. The percentage of players getting better vs. worse is summarized in each chart:
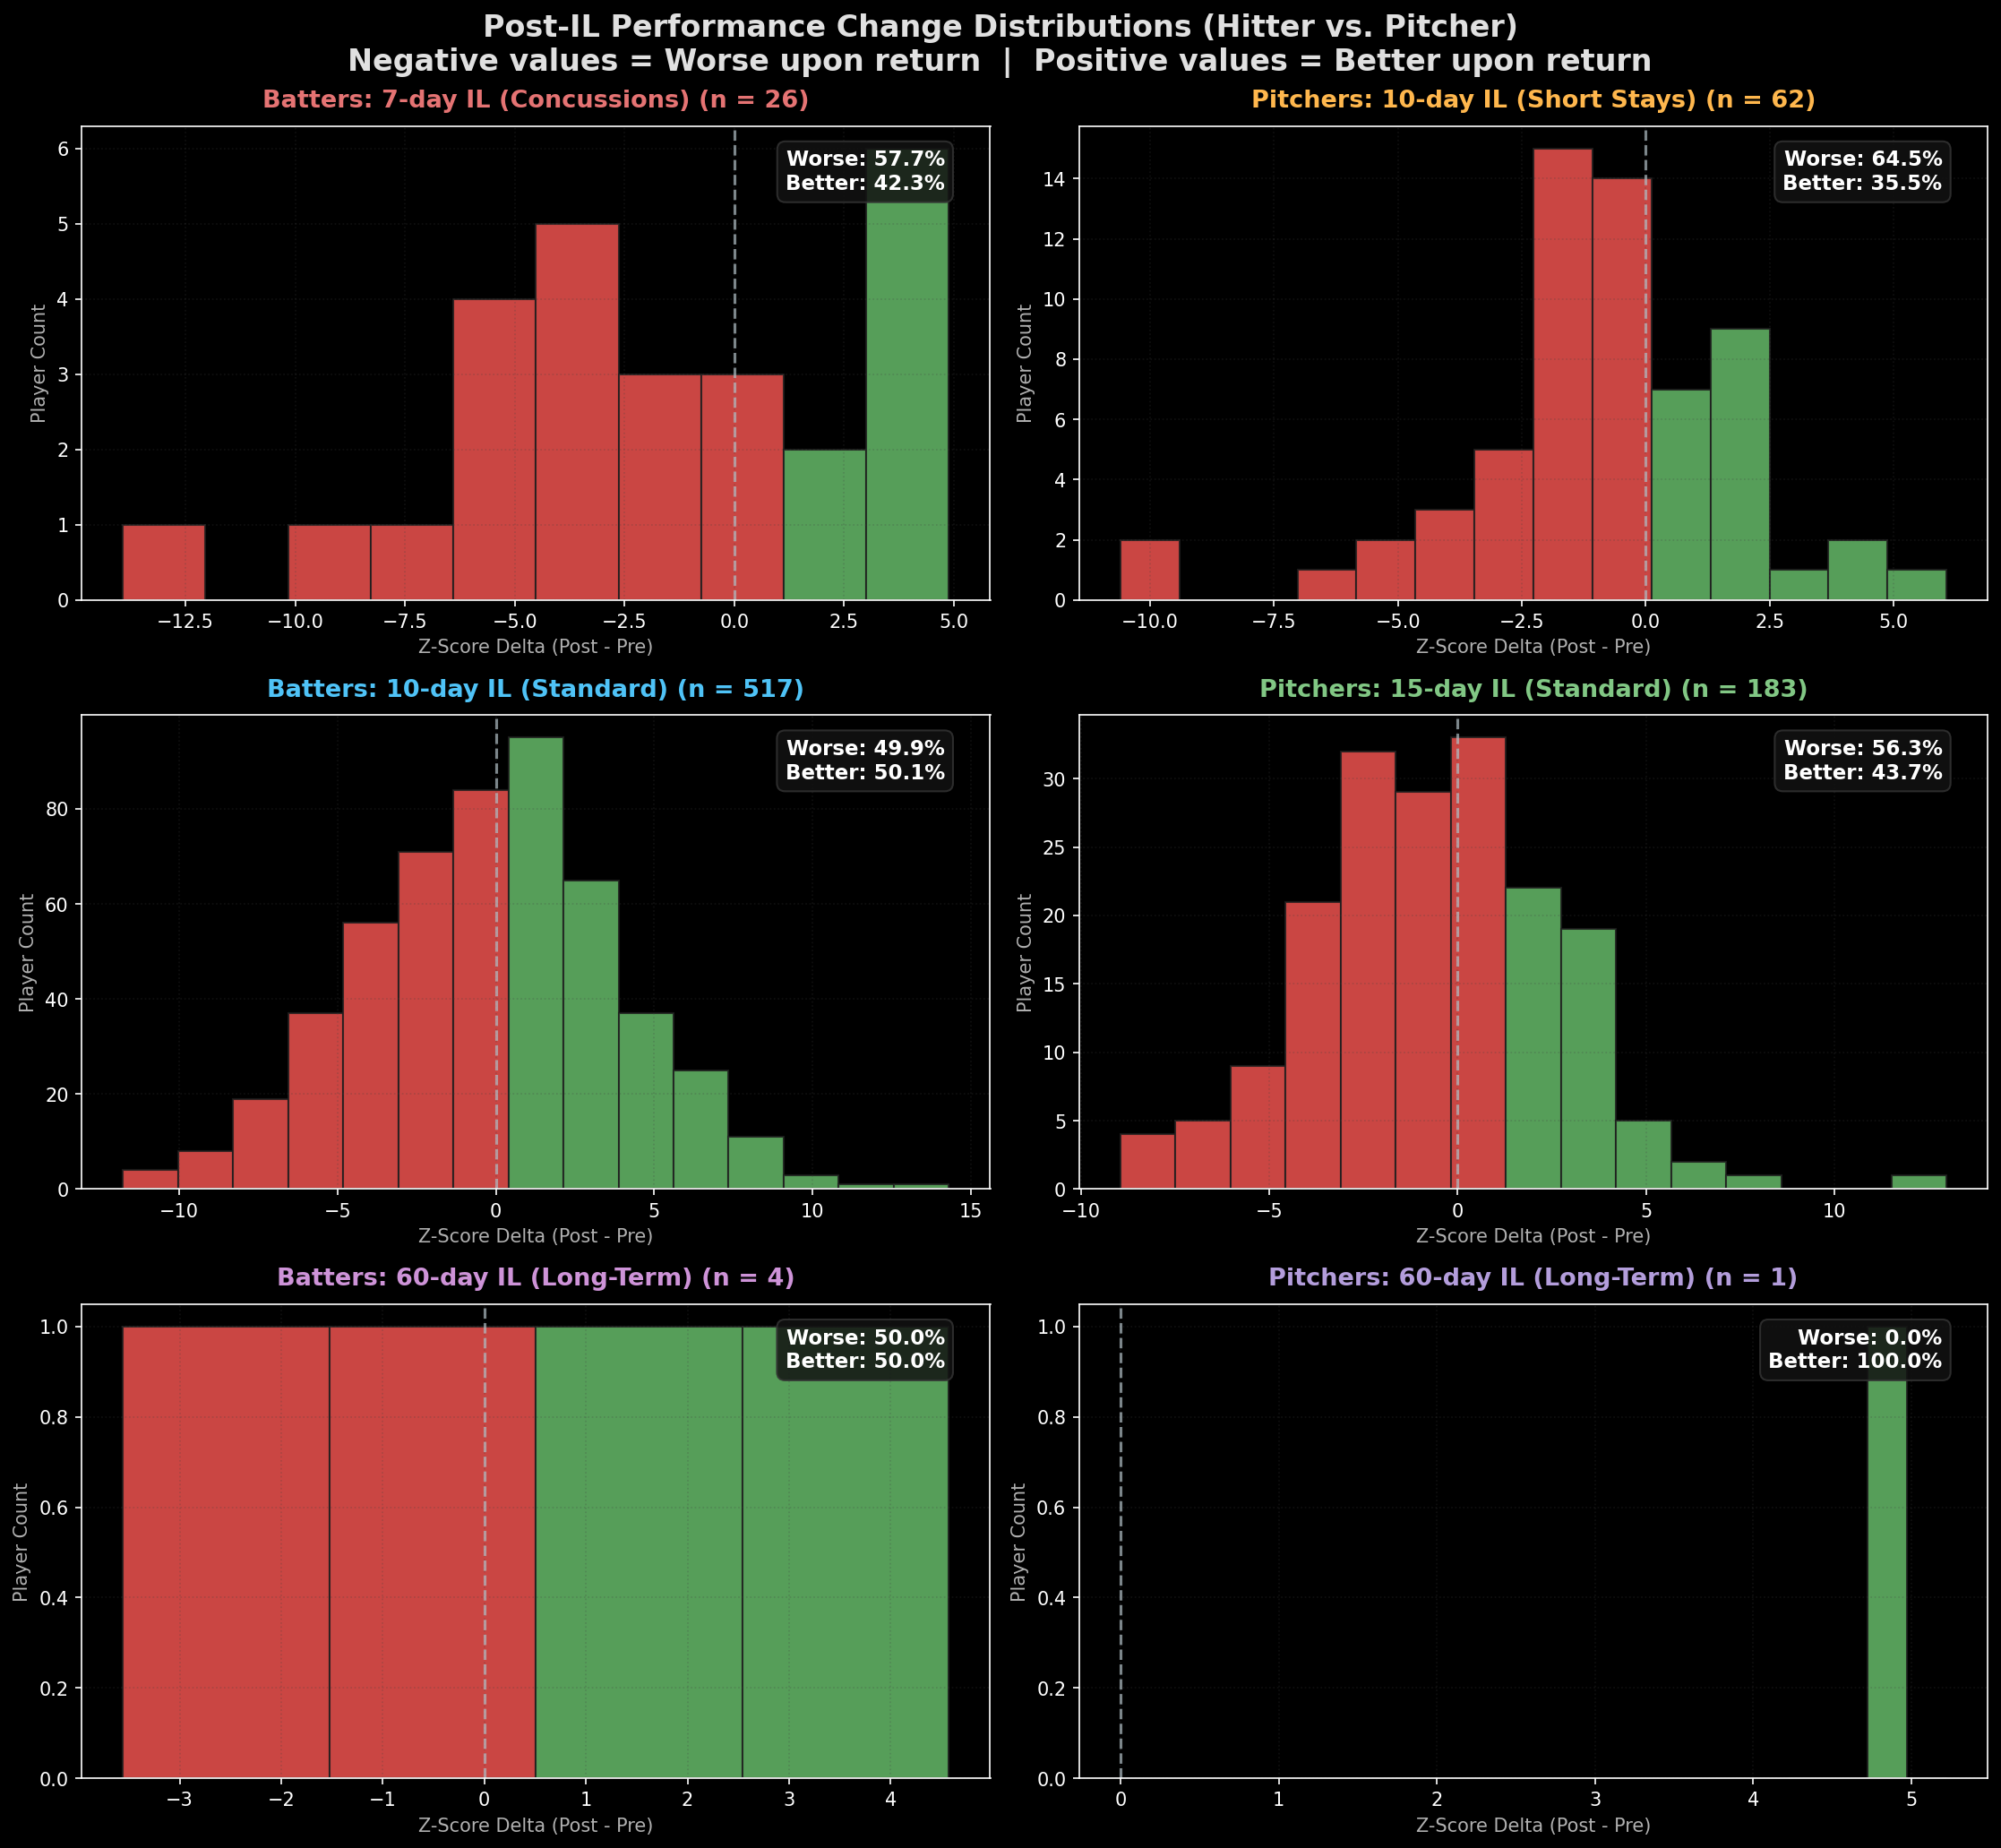
Batters: Summary of Improvement vs. Regression by IL Type
| IL Type | Stints | Worse % (< 0 Delta Z) | Better % (>= 0 Delta Z) | Median Z-Score Delta | Fantasy Outlook |
|---|---|---|---|---|---|
| 7-day IL | 26 | 57.7% | 42.3% | -1.76 | High Risk: Avoid starting players immediately upon return from concussion IL. |
| 10-day IL | 517 | 49.9% | 50.1% | +0.02 | Neutral: Standard stays for hitters return very close to baseline performance. |
| 60-day IL | 4 | 50.0% | 50.0% | +2.06 | Buy Candidate: Long-term recovery allows batters to return at full strength. |
Pitchers: Summary of Improvement vs. Regression by IL Type
| IL Type | Stints | Worse % (< 0 Delta Z) | Better % (>= 0 Delta Z) | Median Z-Score Delta | Fantasy Outlook |
|---|---|---|---|---|---|
| 10-day IL | 62 | 64.5% | 35.5% | -0.67 | Heavy Fade: Short-stay pitchers are frequently rushed and highly volatile. |
| 15-day IL | 183 | 56.3% | 43.7% | -0.66 | Moderate Fade: Standard pitcher IL stays lead to minor ratio inflation. |
| 60-day IL | 1 | 0.0% | 100.0% | +4.72 | Tiny Sample: Rebound gains are high, but sample size is negligible. |
4. Performance Decay by Position and IL Length
Batters by IL Length
Standard hitter IL stays (10-day) are remarkably stable. However, the 7-day IL represents a severe slump:
| IL Type | Stints | Avg Duration (Days) | Pre OPS | Post OPS | OPS Δ | R Δ | HR Δ | RBI Δ | SB Δ |
|---|---|---|---|---|---|---|---|---|---|
| 7-day IL | 26 | 15.3 | 0.782 | 0.694 | -0.088 | -1.1 | -1.1 | -2.1 | -0.6 |
| 10-day IL | 517 | 21.7 | 0.718 | 0.717 | -0.001 | -0.2 | +0.1 | -0.1 | -0.3 |
| 60-day IL | 4 | 75.0 | 0.701 | 0.759 | +0.057 | +0.3 | -0.4 | -0.1 | +0.8 |
Starting Pitchers (SP) by IL Length
Starting pitchers activated from standard 15-day stays see their ERA jump by an average of +0.46 and their 28-game Quality Starts total drop by -2.5:
| IL Type | Stints | Avg Duration (Days) | Pre ERA | Post ERA | ERA Δ | Pre WHIP | Post WHIP | WHIP Δ | K/9 Δ | QS Δ |
|---|---|---|---|---|---|---|---|---|---|---|
| 10-day IL | 14 | 3.2 | 3.56 | 4.18 | +0.62 | 1.21 | 1.32 | +0.12 | +0.2 | -1.9 |
| 15-day IL | 35 | 23.3 | 4.36 | 4.82 | +0.46 | 1.33 | 1.37 | +0.04 | -0.1 | -2.5 |
| 60-day IL | 1 | 62.0 | 6.15 | 3.84 | -2.32 | 1.29 | 1.20 | -0.09 | +2.7 | +5.6 |
Relief Pitchers (RP) by IL Length
Relievers show a similar trend: 10-day activations are disastrous for ERA (+1.11), while 15-day activations result in a mild ERA increase (+0.21) alongside a drop of -1.2 Saves/Holds over their first 28 active appearances back:
| IL Type | Stints | Avg Duration (Days) | Pre ERA | Post ERA | ERA Δ | Pre WHIP | Post WHIP | WHIP Δ | K/9 Δ | SVHD Δ |
|---|---|---|---|---|---|---|---|---|---|---|
| 7-day IL | 1 | 8.0 | 3.18 | 4.80 | +1.62 | 1.41 | 1.27 | -0.15 | +5.7 | +1.7 |
| 10-day IL | 48 | 3.6 | 3.05 | 4.16 | +1.11 | 1.20 | 1.27 | +0.07 | -0.4 | +0.1 |
| 15-day IL | 148 | 27.2 | 3.96 | 4.17 | +0.21 | 1.30 | 1.32 | +0.03 | -0.3 | -1.2 |
5. Performance Decay by Injury Category
Breaking down post-activation performance by specific injury types highlights the physical issues that suppress player value most heavily:
Hitters (Key Categories)
- Concussions (All): Leads to a major OPS slump (-0.105 overall), with counting stats scaling down significantly. Avoid starting concussed hitters for at least 2–3 weeks post-activation.
- Knee (All): Causes a moderate OPS drag (-0.046) and a significant drop in RBI production (-1.0 RBI per 28 games).
- Hamstrings & Obliques (10-day): Returnees are surprisingly stable (Hamstrings $+0.004$ OPS; Obliques $-0.012$ OPS), indicating players are generally well-rehabbed before activation.
Starting Pitchers (Key Categories)
- Shoulder (15-day): The most dangerous injury to return from. Average ERA increases by +1.53, WHIP goes up by +0.30, and K/9 drops by -1.3.
- Elbow/UCL (15-day): Ratio inflation is moderate (ERA +0.51, WHIP +0.05), but workload drops sharply with Quality Starts down by -3.4.
- Back/Spine (15-day): The only category where SPs return better (ERA -0.51, WHIP -0.15), indicating back rest is highly restorative.
6. Extreme Case Studies (2023 - 2026)
These are some of the most extreme cases of performance swings post-activation:
Hitters: Largest Post-IL OPS Drops
| Player | Injury Category | IL Duration | Pre OPS | Post OPS | OPS Δ | HR Δ | SB Δ |
|---|---|---|---|---|---|---|---|
| Logan O’Hoppe | Concussion | 152 days | 1.014 | 0.416 | -0.598 | -10.8 | +0.0 |
| Max Muncy | Oblique/Rib | 24 days | 1.109 | 0.562 | -0.546 | -2.9 | -1.0 |
| Cristian Pache | Elbow/UCL | 49 days | 0.957 | 0.433 | -0.524 | -2.7 | +0.5 |
| Tyler O’Neill | Concussion | 5 days | 1.209 | 0.695 | -0.514 | -9.1 | -1.9 |
| Evan Longoria | Back/Spine | 23 days | 0.921 | 0.448 | -0.474 | -6.0 | +0.0 |
Pitchers: Largest Post-IL ERA Increases
| Player | Injury Category | IL Duration | Pre ERA | Post ERA | ERA Δ | Pre WHIP | Post WHIP | WHIP Δ |
|---|---|---|---|---|---|---|---|---|
| Shawn Dubin | Elbow/UCL | 49 days | 1.33 | 10.80 | +9.47 | 1.13 | 1.88 | +0.74 |
| Kyle Freeland | Shoulder | 13 days | 2.30 | 11.47 | +9.18 | 1.09 | 2.14 | +1.05 |
| Steven Matz | Elbow/UCL | 15 days | 3.34 | 12.10 | +8.76 | 1.05 | 2.28 | +1.22 |
| Yunior Marte | Shoulder | 53 days | 2.70 | 11.37 | +8.67 | 1.27 | 2.53 | +1.25 |
| Trevor Richards | Other/Unspecified | 15 days | 2.81 | 10.80 | +7.99 | 1.06 | 1.91 | +0.85 |
7. Roster Strategy Rules for Fantasy Managers
- Discount Returnees: Do not plug SPs or concussed hitters back into your active lineup on day one. Bench them for their first 2–3 starts or active games to absorb the initial ratio inflation.
- Fade Short-Stay Pitchers: Be extremely cautious when buying or trading for pitchers activated exactly after 10–12 days. They are statistically the most volatile.
- Hold Back-Injured Pitchers: If a starting pitcher has a back strain, this is one of the few injuries where the rest period actually improves subsequent performance. Hold or buy low.
- Value 60-Day Rebounds: If a player has survived a 60-day IL stint and is completing a full rehab assignment, they represent a strong trade target—the long recovery timeline translates to a clean bill of health.
Last Updated: 2026-06-12